It is difficult to obtain high quality in situ observations of the Arctic ice sheets and glaciers as in situ observational networks are comparatively sparse.
Challenges:
The main challenge is to obtain high quality in situ observations of the Arctic ice sheets and glaciers. In recent years a range of satellite sensors are capturing observations of specific interest for the study of ice sheets and glaciers. These include ice elevation and ice mass changes and ice velocity maps. However in situ observational networks are comparatively sparse but are vital to provide ground-truth for the satellite products. Logistical difficulties often mean that it is not possible to revisit instruments more than once every few years, ensuring that robustness takes precedence over other factors. There are a number of efforts to measure parameters around the Greenland ice sheet, nonetheless there is a need to improve the links and integration between these different activities in order to produce new and enhanced climate services needed for the increasingly accessible Arctic region.
Results obtained in INTAROS:
Climate change affects and alters the processes governing the mass balance of the Greenland ice sheet, implying that new vital parameters need to be observed. In INTAROS, we have developed new robust instruments and observational systems to monitor several of these, including rain falling on the ice sheet, the water-equivalent of snow falling in the melt zone and high-precision positioning and elevation measurements of the ice sheet stations. The latter supports the use of near-real time weather data over the ice sheet by meteorological institutions, creating synergy between ice sheet observations and weather services.
INTAROS has also facilitated the development and implementation of regularly updated calculation of the total mass balance of the Greenland ice sheet, based on a fusion of a satellite-derived ice velocity product, regional climate model output and a model for basal melt. This data product ranges from 1840 to a week into the future as a forecast, on the spatial scale of individual outlet glaciers and catchments.
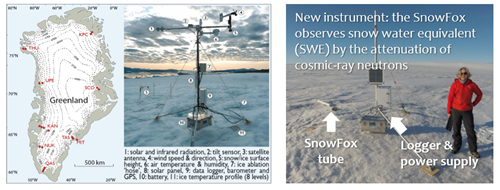
Figure 1: Left: Map of the Greenland Ice Sheet with location of some AWSs and photo of an AWS with all the sensors. Right: Photo of the Snowfox system. Copyright: Andreas Ahlstrøm, GEUS.
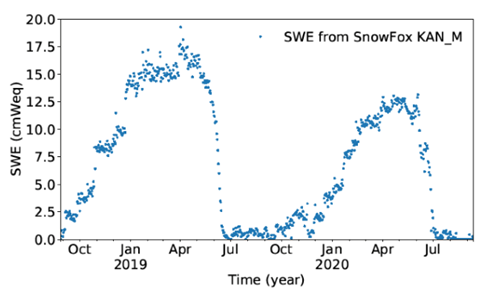
Figure 2: Example of SWE data over two years from from the Snowfox instrument at KAN_M.
12-10-2021