The challenge is to improve and validate the ice concentration retrieval algorithms in the summer season.
Challenges:
Satellites provide the most important data for long-term monitoring of the Arctic sea ice. Sea ice concentration and extent is perhaps the best-observed climate variable in the Arctic with four decades of systematic monitoring. However, there is a significant uncertainty in retrieval of quantitative data on sea ice concentration from microwave satellite data due to melt-ponds in the summer season. A main challenge is to improve and validate the retrieval algorithms for ice concentration and other variables, in particular in the summer season. To provide data on variables that cannot be observed from satellite (ice draft, deformation, ridges) it is important to develop and operate in situ and underice observing systems throughout the seasonal cycle and in different areas of the Arctic.
Results from INTAROS:
Several new or improved satellite data products have been developed: high resolution sea ice concentration (SIC), thin sea ice thickness and sea ice type, i.e. the multiyear ice concentration, and sea ice displacement at large and at medium scale. The data products are available from https://www.seaice.uni-bremen.de/start/ and http://cersat.ifremer.fr. Examples are shown below.
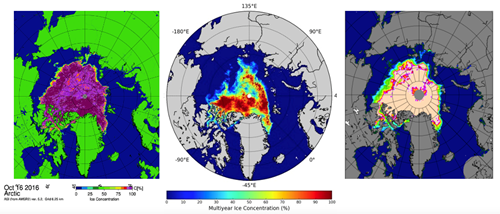
Figure 1: Sea ice products derived from passive microwave data obtained on 16 October 2016: Left: ASI Sea ice concentration map. Centre: Multiyear ice concentration. Right: Thickness of thin sea ice.
During INTAROS, in-situ sea ice observations were collected in the framework of several international Arctic field campaigns (CHINARE, NABOS2018, CAATEX2019, MOSAiC). In those campaigns, up to 38 SIMBA buoys have been deployed in different regions in the Arctic Ocean and drifted with the ice floes mainly following the Beaufort Gyre and the Transpolar Drift. Ten of these buoys were managed by FMI under the INTAROS project. Data products obtained from the SIMBA buoys include snow and ice temperature profiles and thickness. These data are currently exploited in process studies focusing on sea ice thermodynamic, mass balance, surface energy budget, and in the development of routines to derive sea ice properties.
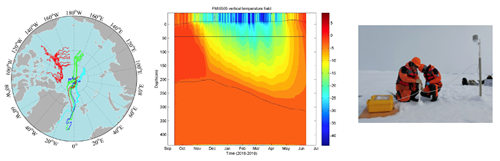
Figure 2: Left: Trajectories of SIMBA buoys deployed in the period 2018-2020. Red: CHINARE2018 (11 buoys), green: NABOS2018 (5 buoys), blue: CAATEX2019 (2 buoys), light blue: MOSAiC2019 (leg1:15 buoys, not all of them are shown in the map) and red in the central Arctic: MOASiC2020 (leg5: 4 buoys). Centre: Example of temperature profile data from a FMI SIMBA buoy. The temperature data are used to derive snow thickness and ice thickness through the seasonal cycle from September 2018 to June 2019. Right: Deployment of a SIMBA buoy. Copyright: Bin Cheng, FMI.
Sea ice surface radiation budget was measured with the FMI broadband radiation station during the MOSAiC experiment from November 2019 until November 2020. The station included upward and downward facing pyranometers and pyrgeometers to measure the surface shortwave and longwave radiative budgets, as well as an upward facing sunshine pyranometer to measure the diffuse global radiation. The station was complementary to other similar stations installed on different surface types (first- and second-year ice, melt ponds, ridges, leads) to observe the sasonal surface evolution of the sea ice surface radiation budget. Drones were used to measure the surface albedo over sea ice, as they enable the characterization of the heterogeneity of the surface and the area-averaged measurement of the radiation fluxes. These measurements are being used to assess the spatial representativeness of the fixed-station measurements and to provide the ground-truth for the validation of models and satellite albedo products.
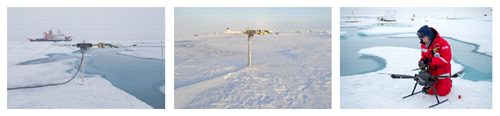
Figure 3: The FMI broadband radiation station was installed on the main ice floe of the MOSAiC experiment. It was operated throughout the experiment. The photos to the left and in the centre are from leg 5 (Photo: R. Pirazzini, FMI). The photo to the right shows the SPECTRA drone equipped with upward and downward looking broadband and spectral radiometers (Photo: J. Rohde).
12-10-2021